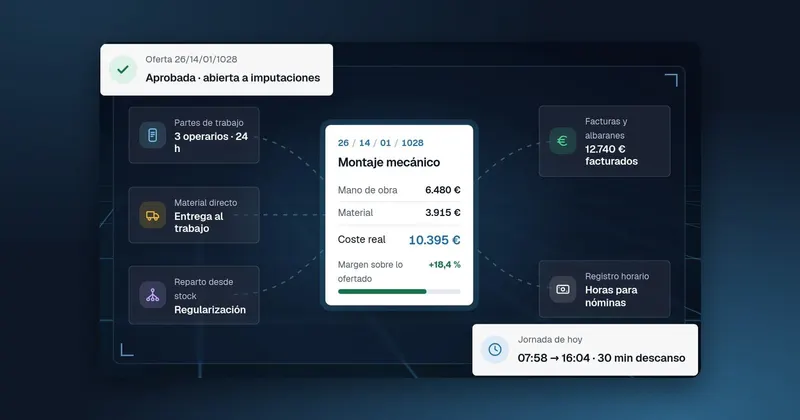
A technical services company can be full of work and still end the year with little profit. Almost always the warning signs were there: jobs that ate up more hours than quoted, quotes that were not accepted, materials sitting idle in the warehouse, finished jobs that took too long to invoice. The problem is that nobody was looking at them regularly. This article proposes a short set of KPIs, how to calculate them with the data you already generate and what to do when they go off track.
A few well-chosen KPIs
The usual mistake is trying to measure everything. Nobody looks at a dashboard with forty figures. It is better to choose between six and ten KPIs that answer the questions that really matter to you: whether you make money on your jobs, whether your people are working on billable tasks, whether you are selling well and whether you get paid on time. Each KPI should have an owner and a review frequency.
Job KPIs
These tell you whether the business works, job by job.
| KPI | How it is calculated | What it tells you |
|---|---|---|
| Margin per job | (Revenue − labour cost − material cost) / revenue | Which jobs make you money and which do not |
| Hours variance | Actual hours / quoted hours | Whether you quote labour correctly |
| Materials variance | Actual materials / quoted materials | Whether you measure materials properly and control waste |
| Margin by type of activity | Margin grouped by assembly, maintenance, repairs… | Which lines of business pay off |
| Margin by customer | Margin grouped by customer | Which customers are genuinely profitable |
For these KPIs to work, each job needs its own code, with all hours and materials charged to it. Without that, margin per job is guesswork.
Labour KPIs
In a services company, labour is usually the main cost. It is worth monitoring separately:
- Percentage of hours charged to jobs: hours charged to jobs divided by hours recorded in the working time record. It is the most direct measure of time lost to waiting, travelling or gaps.
- Overtime as a share of total hours: a high, sustained percentage points to understaffing or poor planning, and makes jobs more expensive.
- Actual hourly cost by category: review it at least whenever the collective agreement changes, so that the price list used in your quotes does not fall behind.
- Hours per job in progress: how many hours each open job has used compared with the quoted hours, so you can react before it finishes.
Sales, materials and invoicing KPIs
Quotes
- Acceptance rate: amount accepted divided by amount quoted, by customer and by type of activity. A very low rate with one customer may mean you quote too high or that the customer only asks you for prices to compare.
- Order book: the value of approved quotes still to be carried out. It tells you how much work you have secured.
Materials and warehouse
- Stock value: how much money is sitting on your shelves. If it grows without any growth in activity, there is idle material.
- Shrinkage per period: the value of stock adjustments. A sudden jump deserves a review.
Invoicing
Making money on a job is of little use if you invoice late. Two simple KPIs:
- Completed work pending invoicing: the cost or value of jobs with hours and materials but no invoice. If it grows, money is being lost along the way.
- Days between job completion and invoice: the shorter it is, the sooner you get paid and the fewer arguments with the customer.
These two KPIs are among the easiest to improve: often it is enough for someone to review the list every week.
What to do when a KPI goes off track
A KPI is only worth having if it prompts a reaction. Some guidelines for the most common cases:
- The margin on a type of activity drops: review the latest jobs of that type section by section. There is usually a phase that is always quoted too low.
- The percentage of hours charged drops: look at internal codes and waiting time. If there is no explanation, the work reports may not be being filled in properly.
- Stock rises without a rise in activity: check which items are not moving and stop automatic replenishment purchases.
- The amount pending invoicing grows: go through job by job to see what is missing (a customer signature, a delivery note, a measurement) and assign it to someone with a date.
- The acceptance rate drops: compare your prices by section with those of the jobs you did win, and talk to the customers who stopped accepting.
Not every variation is bad news. A month with many training hours will lower the percentage of hours charged, and that can be a good investment. What matters is that the variation has a known explanation.
How to set up tracking
- Choose the KPIs and write down, for each one, its formula, its owner and how often it is reviewed.
- Make sure the underlying data exists: coded jobs, work reports with hours per job, materials charged to jobs, invoices linked to their job.
- Prepare a report that updates itself from that data, instead of rebuilding a spreadsheet every month.
- Review it in a short, regular meeting. What is not discussed does not get corrected.
- After a year, remove the KPIs nobody uses and add the ones you have missed.
KPIs in GControl
GControl codes quotes and jobs by year, customer and type of activity, charges work reports and materials to them, and gives you the cost, revenue and profit of each job. To make use of the information, it offers reports in Excel pivot tables, quick and versatile, from quotes to cost, revenue and profit analyses, and a Power BI dashboard accessible from your mobile, the web or your PC. You also get the stock valuation report and the hours from the work reports valued with the price list by job category.
You can see what data it captures in cost per job and go through all the GControl features.